1. Ascendas
2. CDL
3. Far East
4. Frasers
5. Ascott
6. OUE
I decided to do this exercise because they piqued my interest and I couldn't find any good comparison on the net.
Take note I will only look at them from a high-level point of view, as I have no time to dig into the details for each of them.
Ascott and CDL have been around for more than 10 years, so they have more data for us to make an accurate judgment, while the others are still relatively new. I assume all the data, taken from MorningStar and Dividends.sg, is correct (or at least roughly correct).
Revenue
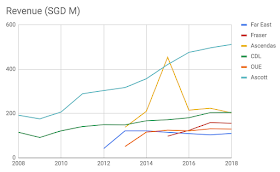
Ascott has been growing its revenue very well (~10% CARG from 2008-2018), while CDL is a much slower grower. For the rest, the revenue is quite flattish except for Ascendas and Fraser which showed some slight growth over the past few years. I don't think it's meaningful to calculate the CARG for the others as the timeframe is quite short.
Net Income
The net income chart shows a very different picture.
Even though Ascott has been growing its revenue strongly, its net income has been whipsawing over the years. The net income for CDL dipped before recovering lately.
During the GFC, the net income for CDL and Ascott went negative but quickly recovered.
The net income for Far East is on a downtrend while the net income for the rest is whipsawing.
Dividends (DPU / S$ cent per share)
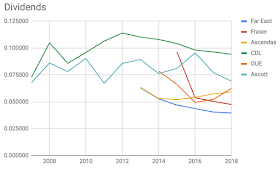
Now let us look at the dividends which is what many of us care about for investing in Trusts and REITs. As expected, the dividends correlate with the net incomes.
All show a downward trend except for Ascendas and Ascott, and a recovery is not in sight.
Only Ascendas shows an uptrend but the timeframe is too short to make any solid conclusion.
Rights Issues / Scrip Dividends / Private Placements
Above is the dividends table from which I plotted the dividends chart. Cells highlighted in pale orange mean there was at least one share dilution action in that year.
Ascott has the most number of share dilution action while Far East has none.
Price Action
I look at the price action to have a sense of which Trust gives the biggest capital gain since mid-2015 (around the time the newest Trust, Fraser, was listed).
Ascendas (Q1P dark purple line) gave the biggest gain and the rest are far from it.
Conclusion
To investigate further, one should look at other metrics such as the quality of assets, gearing ratio, RevPAR, and ADR.
However, based solely on the data above, if I were to make a choice, Ascendas does seem to be the overall winner here.
CDL and Ascott have lacklustre performance over the past 10 years.
Far East and OUE have poor performance as well in the past 5 years.
Welcome any feedback and opinions.


No comments:
Post a Comment