I share deep insights in investing and finance and my journey towards a multi-million-dollar net worth for early retirement.
Top Pages
▼
Monday, December 31, 2018
Net worth review 2018
As the year comes to an end, I have reviewed my net worth and reflected on my life and investing journey. My short investing journey began in 2016 with < 10k vested and in this year I have taken a much more serious tone towards portfolio management given the increased amount vested. I have learned much indeed in this turbulent market.
My net worth details : https://my-radical-thoughts.blogspot.com/p/blog-page.html
Portfolio details: https://my-radical-thoughts.blogspot.com/p/my-portfolio.html
Everything has been dropping this year: cryptos, COE, stocks, bonds. The unexpected COE downtrend has affected my car resale value.
I have screened more than 300 stocks in SGX this year and uncovered gems several of which I have done more in-depth studies and vested in them when their prices came down from the peaks.
I intend to hold for at least 5 years and hopefully I will be substantially rewarded.
Net worth comes from an above-average job, abnormally high savings rate and some other things.
Tuesday, December 11, 2018
High-level financial analysis of H-Trusts in SGX
In this article, I will look at the hospitality trusts (a.k.a. H-Trust) listed in SGX. Currently, there are 6 such H-Trusts, namely:
Even though Ascott has been growing its revenue strongly, its net income has been whipsawing over the years. The net income for CDL dipped before recovering lately.
1. Ascendas
2. CDL
3. Far East
4. Frasers
5. Ascott
6. OUE
I decided to do this exercise because they piqued my interest and I couldn't find any good comparison on the net.
Take note I will only look at them from a high-level point of view, as I have no time to dig into the details for each of them.
Ascott and CDL have been around for more than 10 years, so they have more data for us to make an accurate judgment, while the others are still relatively new. I assume all the data, taken from MorningStar and Dividends.sg, is correct (or at least roughly correct).
Revenue
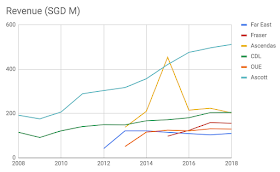
Ascott has been growing its revenue very well (~10% CARG from 2008-2018), while CDL is a much slower grower. For the rest, the revenue is quite flattish except for Ascendas and Fraser which showed some slight growth over the past few years. I don't think it's meaningful to calculate the CARG for the others as the timeframe is quite short.
Net Income
The net income chart shows a very different picture.
Even though Ascott has been growing its revenue strongly, its net income has been whipsawing over the years. The net income for CDL dipped before recovering lately.
During the GFC, the net income for CDL and Ascott went negative but quickly recovered.
The net income for Far East is on a downtrend while the net income for the rest is whipsawing.
Dividends (DPU / S$ cent per share)
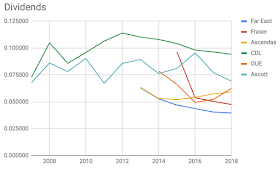
Now let us look at the dividends which is what many of us care about for investing in Trusts and REITs. As expected, the dividends correlate with the net incomes.
All show a downward trend except for Ascendas and Ascott, and a recovery is not in sight.
Only Ascendas shows an uptrend but the timeframe is too short to make any solid conclusion.
Rights Issues / Scrip Dividends / Private Placements
| Far East | Fraser | Ascendas | CDL | OUE | Ascott | |
| 2018 | 0.039700 | 0.047613 | 0.059400 | 0.094300 | 0.062600 | 0.069220 |
| 2017 | 0.040500 | 0.050458 | 0.057400 | 0.096500 | 0.052300 | 0.077480 |
| 2016 | 0.043800 | 0.053853 | 0.054200 | 0.098200 | 0.049500 | 0.095630 |
| 2015 | 0.047100 | 0.096645 | 0.052125 | 0.104300 | 0.066300 | 0.081110 |
| 2014 | 0.052800 | 0.053201 | 0.108100 | 0.078600 | 0.076350 | |
| 2013 | 0.063100 | 0.063608 | 0.110300 | 0.089360 | ||
| 2012 | 0.114100 | 0.085800 | ||||
| 2011 | 0.106500 | 0.067360 | ||||
| 2010 | 0.096000 | 0.090400 | ||||
| 2009 | 0.085900 | 0.078300 | ||||
| 2008 | 0.105000 | 0.086200 | ||||
| 2007 | 0.072600 | 0.067700 |
Above is the dividends table from which I plotted the dividends chart. Cells highlighted in pale orange mean there was at least one share dilution action in that year.
Ascott has the most number of share dilution action while Far East has none.
Price Action
I look at the price action to have a sense of which Trust gives the biggest capital gain since mid-2015 (around the time the newest Trust, Fraser, was listed).
Ascendas (Q1P dark purple line) gave the biggest gain and the rest are far from it.
Conclusion
To investigate further, one should look at other metrics such as the quality of assets, gearing ratio, RevPAR, and ADR.
However, based solely on the data above, if I were to make a choice, Ascendas does seem to be the overall winner here.
CDL and Ascott have lacklustre performance over the past 10 years.
Far East and OUE have poor performance as well in the past 5 years.
Welcome any feedback and opinions.
Saturday, December 8, 2018
REITS and Trusts to avoid
Investing in REITs is rewarding because of the juicy dividends. However, certain REITs have higher risks than others.
The market is forward-looking and very efficient in pricing equities and hence those REITs with yield > 7% usually have some inherent risks involved. Do not ever blindly invest in REITs with high dividends. The recent plunges in Asian Pay TV and others serve as a wake-up call / reminder to many of us.
Here, I will present a non-exhaustive list of REITs and Trusts that I will avoid. You may choose to disagree. I welcome any feedback. Typically once I see red flags such as short track record, consistently dropping DPU for a few years, unusually high gearing or concentration risks (e.g. tenant, geographical), I will avoid.
The market is pricing the REITS below with yields of between 6 and 10%, but I will not take the risk.
*Update*: I look at the business fundamentals only. Even if the NAV is very attractive or the price has reached 52-week low, I would not touch them until the fundamental improve. After all, the fundamental determine whether the dividend is sustainable.
For the following, I will avoid for now but I will continue to monitor their track record and even may start to invest in them once the red flags are gone.
The market is forward-looking and very efficient in pricing equities and hence those REITs with yield > 7% usually have some inherent risks involved. Do not ever blindly invest in REITs with high dividends. The recent plunges in Asian Pay TV and others serve as a wake-up call / reminder to many of us.
Here, I will present a non-exhaustive list of REITs and Trusts that I will avoid. You may choose to disagree. I welcome any feedback. Typically once I see red flags such as short track record, consistently dropping DPU for a few years, unusually high gearing or concentration risks (e.g. tenant, geographical), I will avoid.
The market is pricing the REITS below with yields of between 6 and 10%, but I will not take the risk.
*Update*: I look at the business fundamentals only. Even if the NAV is very attractive or the price has reached 52-week low, I would not touch them until the fundamental improve. After all, the fundamental determine whether the dividend is sustainable.
| REIT | Type | Pros & Cons |
| Accordia Golf Trust | Country Club | - Not worth investing |
| Asian Pay TV | Retail | - Poor business fundamentals - Cable TV is Sunset industry (?) |
| Cache logistics | Industrial / Logistics | - Declining earnings - Increasing vacancy |
| Lippo | Retail | Affected by Indo tax. Higher gearing > 45%. DPU affected. |
| Sabana REIT | Industrial | - DPU dropping over past few years |
| Sassuer REIT | Retail | - High concentration risk in China - S-chip stigma - short WALE |
| SoilbuildBiz | Industrial / Logistics | - Declining growth - High gearing |
| StarhillGbl Reit | Retail (12% Commercial) | - DPU dropping for past few years (2018) - Most of revenue from Wisma Atria and Ngee Ann (>60%) - Retail malls target mid to high-end consumers |
For the following, I will avoid for now but I will continue to monitor their track record and even may start to invest in them once the red flags are gone.
| AIMSAMP Cap Reit | Industrial / Logistics | - ascendas REIT seem better - DPU drops from 2016-2018 - revenue growth is flattish |
| BHG Retail Reit | Retail | - portfolio of just five properties in China is very concentrated. - short history in the public eye, and the true long-term resilience of the portfolio cannot be accurately reflected over just a three-year history as a public entity. - the five properties have land use terms expiring between 2042 and 2047. This is only less than thirty years away. Therefore, the REIT may have to fork out additional capital when the time comes to renew the land leases. - manager yet to take its share of distribution http://aspire.sharesinv.com/35947/si-research-should-investors-pay-attention-to-bhg-retail-reit/ |
| CromwellReit EUR | - too new | |
| Dasin Retail | Retail | - wait for a few more years to observe - Concentration risks: 4 malls in Zhongshan City of China’s Guangdong province. (China’s Pearl River Delta) - S-chip stigma Pros: - good growth in 1st year. - gearing only 30% -- room for acquisition |
| EC World REIT | Industrial / Logistics | -Risk: master leases expiring in 2020 - dividend sustainable? - income in RMB but div in SGD https://www.fool.sg/2018/06/20/ec-world-real-estate-investment-trust-the-bear-case/ https://www.theedgesingapore.com/article/5-reasons-not-participate-ec-world-reit%E2%80%99s-ipo http://ernest15percent.com/index.php/2018/07/02/ec-world-reit-potential-strong-growth-ahead-29-jun-18/ |
| IREIT Global | Commercial | - All 5 office properties concentrated in Germany - 51% of gross rental income from 1 tenant (GMG) - 32% from 1 tenant (Deutsche Rentenversicherung Bund) - High leverage (40%) - Lots of short-term debt Average Weighted Debt Maturity: 1.4 years - WALE 3-5 years only - Forex risk (EUR vs SGD) (hedged) Pros: - Avg 98% occupancy - 88% fixed rate debts - All freehold properties |
| Mapletree NAC | Retail | -Festival walk contributes 63% to Net income (concentration risk) - High gearing 40% Pros: - P/B < 1 |


